Observability with Grafana
Observability is the practice of monitoring and analyzing the performance and behavior of complex systems in order to understand their current state and predict future behavior. In recent years, observability has become increasingly important as organizations have begun to rely more heavily on complex systems, such as distributed applications and microservice architectures, to deliver services and applications.
One of the most popular tools for observability is Grafana, an open-source platform that allows users to create, explore, and share dashboards and data visualizations. Grafana integrates with a wide range of data sources, including Prometheus, a popular open-source monitoring and alerting tool. In this article, we will look at how to use Grafana and Prometheus to monitor and analyze the performance of a system.
To begin, you will need to have Grafana and Prometheus installed on your system. If you do not already have these tools installed, you can follow the instructions on the Grafana and Prometheus websites to get started. Once you have these tools installed, you can start setting up your monitoring system.
The first step is to configure Prometheus to scrape data from your system. Prometheus uses a pull-based approach to gather data, meaning that it periodically sends requests to targets (i.e., the systems you want to monitor) to collect metrics. In order to configure Prometheus to scrape data from your system, you will need to specify the targets you want to monitor and the metrics you want to collect.
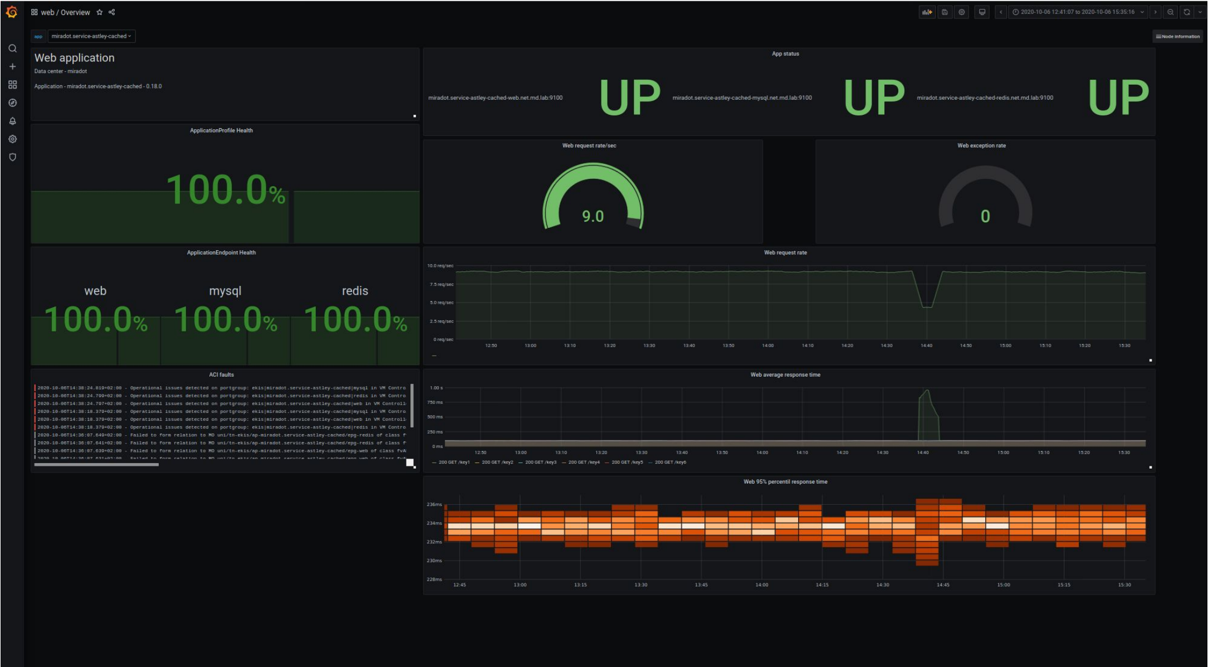
Once you have configured Prometheus to scrape data from your system, you can use Grafana to create dashboards and visualizations that display this data. Grafana allows you to create a wide range of visualizations, from simple line graphs and pie charts to more complex heatmaps and histograms. You can use these visualizations to gain insights into the performance and behavior of your system, such as identifying trends and outliers, and monitoring key metrics such as CPU and memory usage.
In addition to creating dashboards and visualizations, Grafana also allows you to set up alerts that can notify you when certain conditions are met. For example, you can set up an alert that sends a notification when the CPU usage on your system exceeds a certain threshold. This can help you to quickly identify and respond to potential issues with your system, ensuring that it continues to operate at peak performance.
Overall, Grafana and Prometheus are powerful tools for observability, providing users with the ability to monitor and analyze the performance and behavior of complex systems. By using these tools, you can gain valuable insights into your system, identify potential issues, and take action to ensure that your system continues to operate at peak performance.
Let’s create a Dashboard
In this tutorial, we will go through the steps to set up a Grafana dashboard to display data from Prometheus. First, you will need to install Grafana on your system. If you are using a Linux-based operating system, you can use your package manager to install Grafana. For example, on Ubuntu, you can use the following command:
sudo apt-get install grafana
Once Grafana is installed, you will need to start the service and enable it to start automatically on boot. On Ubuntu, you can use the following commands to do this:
sudo systemctl start grafana-server
sudo systemctl enable grafana-server
Next, you will need to install Prometheus on your system. Prometheus is a powerful monitoring and alerting tool that can be used to collect and store data from a variety of sources. To install Prometheus on Ubuntu, you can use the following command:
sudo apt-get install prometheus
Once Prometheus is installed, you will need to create a configuration file for it. The configuration file is used to specify the details of how Prometheus should collect and store data, as well as any alerting rules that you want to set up. A basic Prometheus configuration file might look like this:
global:
scrape_interval: 15s

scrape_configs:

- job_name: "prometheus"
  static_configs:
    - targets: ["localhost:9090"]
After creating the configuration file, you will need to start the Prometheus service and enable it to start automatically on boot. On Ubuntu, you can use the following commands to do this:
sudo systemctl start prometheus
sudo systemctl enable prometheus
With Prometheus and Grafana installed and running, you can now set up a dashboard in Grafana to display data from Prometheus. To do this, you will need to log in to the Grafana web interface and add a new data source. In the data source configuration, you will need to specify the URL of the Prometheus server (e.g. http://localhost:9090) and the access credentials, if any.
Once the data source is configured, you can create a new dashboard and add a panel to display data from Prometheus. In the panel configuration, you will need to specify the metric that you want to display, as well as any filters or other options that you want to use.
With the panel configured, you can save the dashboard and start visualizing your data in Grafana. You can use the dashboard to monitor your system and troubleshoot any issues that might arise.
In this tutorial, we have gone through the steps to set up a Grafana dashboard to display data from Prometheus. By following these steps, you should be able to get started with Grafana and Prometheus and start visualizing your data.